
Cox Automotive - Unified Reporting
Role
Lead Product Designer
Responsibilities
UX Product Discovery
UX Strategy
Interaction Design/Prototyping
Visual Design
Overview
Cox Automotive provides a range of digital tools to help dealerships manage their sales, inventory, and analytics. But their reporting systems were scattered across multiple platforms, making it frustrating for users to get the insights they needed

Product Design Kick-Off
We began with a kickoff meeting alongside our product owners, utilizing Human-Centered Design (HCD) exercises to define the problems we aimed to solve and identify knowledge gaps. Our design process starts with a Lean Canvas where we discover the known, the unknown, our value prop as well as metrics and goals.

Product Design Process
At Cox Automotive our process followed the double diamond agile process.
User Interviews & Analysis
Our next steps consisted of:
Conducting surveys and interviews with stakeholders.
Develop structured interview questions.
Utilize Rose, Thorn, Bud methodology to analyze successes, challenges, and opportunities.
User Interviews
We focused our interviews on 6-8 people with different roles from across our dealerships.

Affinity Clustering
After conducting interviews, we performed affinity clustering with our partners to categorize insights and identify recurring themes.
Key Insights
Too many tools caused a slowed down workflow.
Reports weren’t flexible enough.
Real-time insights were missing.
Mobile reporting was almost unusable.
MVP Priorities:
Create a unified and consistent navigation structure for all reporting tools.
Integrate existing dashboards and reports into a single, cohesive tool.
Develop a primary-use-case dashboard to enhance user experience.
Align the design with the Cox Automotive Design System for consistency.
Engaging our engineering and cross-platform partners early ensured feasibility and alignment across teams
Prototyping and Usability Studies
Find stakeholders for our use case.
Create a prototype with a left-hand vs top nav.
Create interview questions for the study.
Using Figma and its advanced prototyping abilities, I was able to create interactive prototypes for our studies.
Insights
We found that our existing suit of reporting tools had flyout menus from both left and right of the screen with filter bars at the top and popup ranges within dashboards.
Solution & Features
After collaborating with the broader team, my product partners and I set out to:
Explore navigation ideas for our reporting tools.
Explore dashboard options and update the designs to include our design system.
We went through a few rounds of design iterations, checkpoints with product and stakeholders, as well as engineering.
Original Design
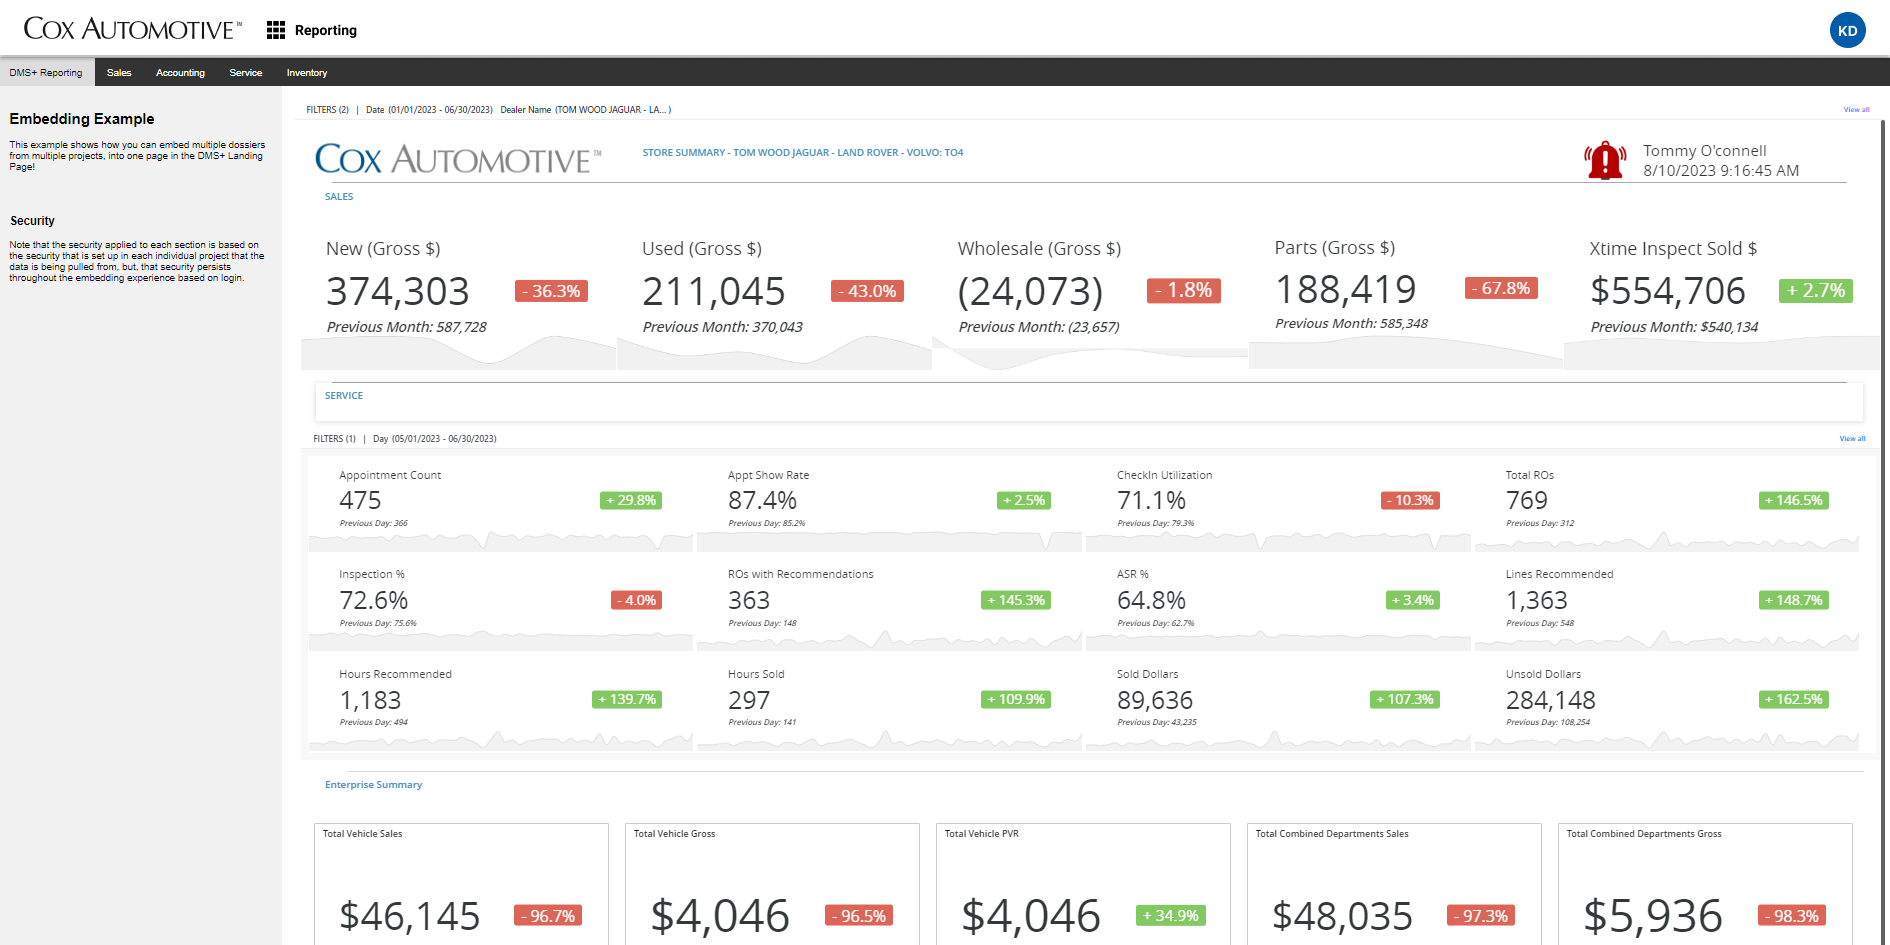
Final Design
Deployment and Evaluation
Gradual rollout of the unified reporting tool across pilot dealerships.
Monitor user adoption and collect performance metrics.
Plan for future enhancements based on continuous user feedback.
Challenges & How We Overcame Them
Stakeholder alignment: Getting buy-in from different teams.
Data integration complexity: Unifying multiple data sources.
Balancing flexibility & simplicity: Ensuring customization without overwhelming users.
Impact & Results
Time saved: Reduced time spent generating and consolidating reports by 17%.
Higher engagement: Increased adoption across dealership staff by 7%.
Improved decision-making: We learned through surveys that dealerships experienced faster insights leading to better business choices.
User feedback: Positive reception from dealerships and stakeholders.
Key Learnings & Takeaways
The importance of user research to uncover hidden pain points.
The value of iteration & testing to refine solutions effectively.
How cross-functional collaboration helps overcome complex challenges.
Final Thoughts
This project completely changed the way dealerships access and use their data. What was once a frustrating, disjointed experience across multiple tools became a simple, unified reporting system that makes it easier to find and act on key insights.
Looking ahead, there’s still plenty of opportunity to take this even further, exploring things like AI-driven insights, deeper customization, and even smarter data visualization.